File input and output

Rack supports reading sweep and volume files in HDF5 format using OPERA information model (ODIM). In addition, supports reading and writing data as images and text files.

Reading and writing HDF5 files

Input files are given as plain arguments or alternatively with explicit command –inputFile , abbreviated -i. If several files are given, they will be internally combined in the internal HDF5 structure, adding datasets incrementally.

Outputs are generated using –outputFile , abbreviated -o. Hence, combining sweep files to a volume is obtained simply with

rack sweep1.h5 sweep2.h5 sweep3.h5 -o volume-combined.h5
Definition: DataSelector.cpp:44

In combining sweep data to volumes, Rack creates and updates one /dataset<i> group for each elevation angle . Further, Rack creates and updates one /data<i> group for each quantity ; new input overwrites existing data of the same quantity.

If quality information – stored under some /quality[i] group and marked with what:quantity=QIND – is read, the overall quality indices are updated automatically. See Reading and combining quality data below for further details.
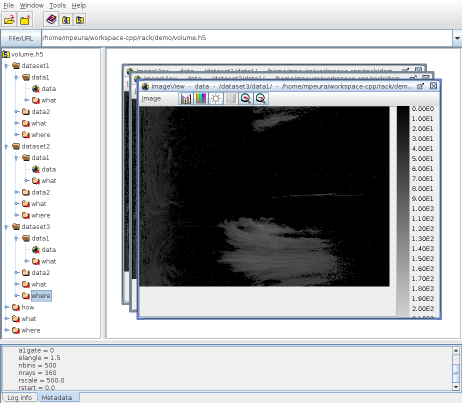
A volume combined from three separate files (illustrated with HDFview).

Reading and writing text files

Using –outputFile , the structure of the current data can be written as plain text in a file (*.txt) or to standard input (-):

rack volume.h5 -o volume.txt

File volume.txt will consist of lines of ODIM entries as follows:

dataset1
dataset1/data1
dataset1/data1/data
dataset1/data1/data:image=[500,360]
dataset1/data1/what
dataset1/data1/what:gain=0.01
dataset1/data1/what:nodata=65535
dataset1/data1/what:offset=-327.68
dataset1/data1/what:quantity="TH"
dataset1/data1/what:undetect=0
dataset1/data1/how
dataset1/data1/how:LOG=2.5

Note that strings are presented in double quotes and arrays as comma-separated values in brackets.

Based on metadata, it is often handy to automatically compose filenames. This is possible using –expandVariables as follows.

rack volume.h5 --expandVariables -o 'incoming-${NOD}_${what:date}-${what:time}.txt'

For using format templates and hadling multiple files on a single command line, see Formatting metadata output using templates.

Volume can be also created using a text file like the one created above, that is, with the desired structure and data types.

rack volume.txt -o volume-new.h5

One can modify the metadata directly from the command line by means of –setODIM <path>:<attribute>=<value> command.

--setODIM <assignment> (section: general)
Set data properties (ODIM). Works also directly: --/<path>:<key>[=<value>]. See --completeODIM
assignment= [/<path>:<key>[=<value>]]

The command has a special shorthand –/<path>:<attribute>=<value> . For example:

rack volume.h5 --/dataset1/how:myKey=myValue -o volume-new.h5
rack volume.h5 --/dataset1/how:myKey=123.456 -o volume-new.h5
rack volume.h5 --/dataset2/data3/what:quantity="PROB" -o volume-new.h5

This feature can be used for completing incomplete ODIM metadata or adding arbitrary metadata. The actual radar data can be read or saved as image files as explained below.

Reading and writing image files

In addition to HDF5 format, Rack support three image formats:

  • Portable Network Graphics (PNG), with (.png ) extension
  • Portable Anymap Format (PNM), grayscale ( .pgm ) and RGB images (.ppm ).
  • Geo-Referenced Tagged Image File Format (GeoTIFF, GTIF), (.tif ), see ref geotiff_remarks below

When writing data with –outputFile (-o) command, the applied image format is determined from the filename extension. By default, the first dataset encountered in the internal data structure is selected, hence typically /data1/dataset1/data . The source can be changed with –select command.

rack volume.h5 -o sweep1.png
rack volume.h5 --select dataset2/data:,quantity=DBZH -o sweep1.pgm
rack volume.h5 --cProj "+proj=longlat +datum=WGS84 +no_defs +ellps=WGS84 +towgs84=0,0,0" -c -o sweep1.tif
A PNG image generated with -o .

Metadata (ODIM variables) are written in the comment lines (PGM and PNM). The syntax follows that of a text dump produced with –outputFile as explained above with volume.txt , but only the last path component (what , where, how) is included. For example, a resulting header of a PGM file - here pruned for illustration - looks like:

P5
# how:freeze=2.1
# how:highprf=570
# how:lowprf=570
# how:polarization="H+V"
# how:rpm=2.82074
# how:task="PPI1_A"
# how:wavelength=5.33
# what:date="20140827"
# what:enddate="20140827"
# what:endtime="090022"
# what:gain=0.5
# what:nodata=255
# what:object="PVOL"
# what:offset=-32
# what:product="SCAN"
# what:quantity="DBZH"
# what:source="WMO:02870,RAD:FI47,PLC:Utajärvi,NOD:fiuta"
# what:startdate="20140827"
# what:starttime="090000"
# what:time="090000"
# what:undetect=0
# where:elangle=0.3
# where:height=118
# where:lat=64.7749
# where:lon=26.3189
# where:nbins=500
# where:nrays=360
# where:rscale=500
# where:rstart=0
# where:towerheight=33
500 360
255

The comments can be overriden with –format command. This experimental feature covers currently:

  • PGM/PPM files: all the comments are replaced by that string.
  • GeoTIFF files: if the argument starts with a curly brace '{' , it is read in as JSON , and (first-level) key-value pairs are stored as GDAL attributes.

In addition, for GeoTIFF files, attributes set with –/how:GDAL:<key>=

will be also added as GDAL variables.

Rack can also save all the data sets in separate files with a single command, producing sweep000.png , sweep001.png and so on. This is achieved with –outputRawImages , abbreviated -O . The command stores the image data directly, without rescaling pixel values.

Reading image files creates and updates internal HDF5 structure, adding grid data:

  1. in the first encountered /data<i> or /quality<i> group containing an empty /data (ie. uninitialized image), or if not found:
  2. in a new /data<i>/data of the existing /dataset<j> with the highest index j

Metadata can be set

  1. by reading them directly from image file comments (text supported by PNG and PNM formats, e.g. what:quantity="DBZH" )
  2. by inputting a text file as explained above
  3. on the command line, like –/dataset1/data2/what:quantity=DBZH (see changing)

Metadata can be set before or after image inputs. Example:

rack volume.txt sweep1.png --/dataset1/data1/where:rscale=500 <commands>

Some important ODIM attributes can be added automatically with –completeODIM command, which sets nbins , nrays , xsize , and ysize equal to data dimensions, if already loaded as image.

Remarks on GeoTIFF images

Rack produces GeoTIFF images under the following limitations:

  • writing is supported only
  • grayscale is supported only
  • applicable to Cartesian products only; polar coordinate system is not supported. GDAL conventions are used in intensity scaling (scale and offset ).
  • support of geodetic data is minimal; use utilities like gdalinfo to check output
  • some projections (e.g. epsg:3844, epsg:3035, and epsg:3995) raise errors – see Cartesian conversions and composites for details.
  • tiling is supported
  • some image viewing programs (ex. ImageMagick's display ) produce rendering errors of 16-bit images having width not multiple of tile width
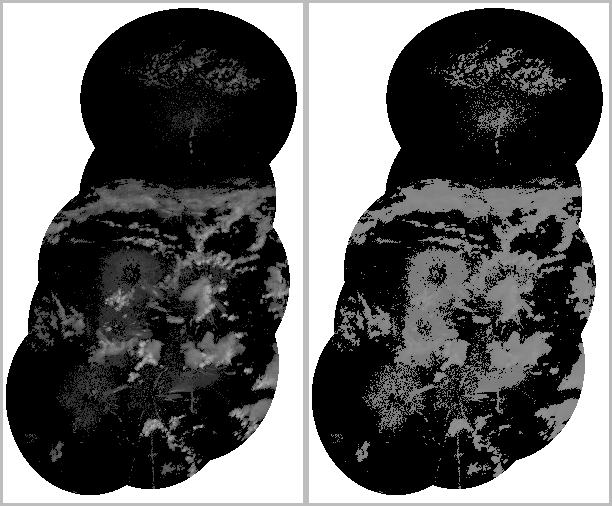
A composite rendered as 8-bit and 16-bit images.

Writing SVG files

Experimental. Rack supports presenting generated PNG images collectively by means of Scalable Vector Graphics (SVG). Alignment of the elements is done horizontally or vertically. All the PNG images that have been written with -o / –outputImage are included automatically in the SVG file. Example:

rack volume.h5 --pCappi 500 -c -o $PWD/cappi-gray.png --palette '' -o $PWD/cappi-rgb.png --outputConf svg:absolutePaths=true -o display-cappi.svg
SVG panel

By default, images are positioned horizontally, from left to right. This can be changed with –outputConf svg , selecting orientation as HORZ or VERT and coordinate direction as increasing (INCR ) or decreasing (DECR ).

group=main ()
orientation= (["HORZ","VERT"])
direction= (["INCR","DECR"])
max=10 (max per row/column)
legend= (["NO","LEFT","RIGHT","DUPLEX"])
title= ()
absolutePaths=false ()
fontSize=12,10,8,6 ()

Example:

rack volume.h5 --pCappi 500 -o $PWD/cappi-polar-DBZH.png -c --palette '' -o $PWD/cappi-rgb.png --outputConf svg:orientation=VERT,direction=DECR,absolutePaths=true -o display2-cappi.svg
SVG panel

Example: time series

rack --outputConf svg:absolutePaths=true --outputPrefix $PWD/ --cSize 300 --script '-Q DBZH -c --palette "" -o out-${what:date|%Y%m%d}.png' --outputConf svg:group=May data-acc/201705?51200_*.h5 --outputConf svg:group=June data-acc/201706?51200_*.h5 -o time-series.svg
SVG panel

Remark. In future versions:

  • the parameters of –outputConf svg may change.
  • title formatting supported (using -c –format )

Note that you can also create SVG files using templates, see Formatting metadata output using templates

Writing HTML files

Experimental. The current data structure can be written to a HTML file which displays the data in a clickable tree. The data arrays are stored in PNG files in sub directory named with the basename of the output file. The structure of the directory repeats the hierarchy of the original HDF5-ODIM data.

Examples:

# Store full data structure
rack volume.h5 -o volume-full.html
# Store selected parts of the structure
rack volume.h5 --outputPrefix $PWD/ --select /dataset1:2/data2:4/data -o volume-partial.html
# Generate and store a Pseudo CAPPI product
rack volume.h5 --pCappi 1500 -c -o pCappi-1500m.html
# Generate a coloured Pseudo CAPPI product and store it
rack volume.h5 --pCappi 1500 -c --encoding quantity='DBZH' --palette 'default' -o pCappi-1500m-RGB.html

Histograms

--histogram <count>,<range>,<filename>,<attribute>,<commentChar> (section: general)
Histogram. Optionally --format using keys index,range,range.min,range.max,count,label
count=0
range=0:0
filename= [<filename>.txt|-]
attribute=histogram [<attribute_key>]
commentChar=# [Prefix for header and postfix for labels]

Example:

rack volume.h5 --select 'quantity=TH' --histogram filename=histogram.dat

The resulting file consists of lines containing values and counts

# ${index} =${count} #${label} [${range}[
# [0,256] [-327.68,327.68]
0 =97192 #undetect [-327.68:-325.12[
1 =0 # [-325.12:-322.56[
2 =0 # [-322.56:-320[
3 =0 # [-320:-317.44[
4 =0 # [-317.44:-314.88[
5 =0 # [-314.88:-312.32[
6 =0 # [-312.32:-309.76[
7 =0 # [-309.76:-307.2[
8 =0 # [-307.2:-304.64[
9 =0 # [-304.64:-302.08[
10 =0 # [-302.08:-299.52[
11 =0 # [-299.52:-296.96[
12 =0 # [-296.96:-294.4[
13 =0 # [-294.4:-291.84[
14 =0 # [-291.84:-289.28[
15 =0 # [-289.28:-286.72[
16 =0 # [-286.72:-284.16[
...
...
...
252 =0 # [317.44:320[
253 =0 # [320:322.56[
254 =0 # [322.56:325.12[
255 =0 # [325.12:327.68[

Example:

rack volume-detected.h5 --select 'data:/quality:,quantity=CLASS' --format '${index}\t${count}\t # ${label}\n' --histogram filename=histogram2.dat
# ${index} ${count} # ${label}
# [0,256] [0,256]
0 160677 #
1 0 #
2 0 #
3 0 #
4 0 #
5 0 #
6 0 #
7 0 #
8 0 #
9 0 #
10 0 #
11 0 #
12 0 #
13 0 #
14 0 #
15 0 #
16 0 #
...
...
...
252 0 #
253 0 #
254 0 #
255 0 #

Illustrating data structure

The contents of hierarchical radar data can be displayed in a simple tree format using outputTree command or by changing file extension to .tre when using the general command -o / –outputFile .

rack volume.h5 -o volume-tree.tre

Rack can be also used to output the tree-like hierarchy of radar data in dot format (http://www.graphviz.org/documentation/). From that format, one may use Graphviz dot program to produce tree graphs in various image formats link png , pdf and svg. For example:

rack volume.h5 --keep dataset1:2/data1:3 -o volume-tree.dot
# Currently --keep preferred to --select
dot volume-tree.dot -Tpng -o volume-tree.png
dot volume-tree.dot -Tpdf -o volume-tree.pdf

The desired path can be selected with –select path=<group>[/<group>] or simply –select <group>[/<group>] because path is the first argument key.
The most relevant groups are dataset: , and data: , and quality: . The colon : is compulsory for separating data<index> groups from lower level data group in ODIM. In the current version, groups what , what and how are handled somewhat automagically. (See Selecting data .)

Data structure illustrations creating by means of dot file output.

Reading and combining quality data

In an operative environment, two parallel processes may perform quality control. Rack intelligently combines the resulting files using the following logic:

  • The main quality field (quantity=QIND ) is updated, based on either target class field (quantity=CLASS) or (quantity=<class-name> ):
    1. If overall classification (quantity=CLASS) is provided, QIND and CLASS will be updated directly from those.
    2. If CLASS is not provided, QIND will be updated from the specific class probability (quantity=<class-name> ).
  • Under the group containing QIND (typically /quality1 ), how:task_args will be updated by the names of the added classes.

In the following example, the quantities (detection classes) applied are those produced by Rack but could be thought as if they were produced by some other software, with same or similar names.

Consider two quality control processes, the first producing detection of EMITTER and JAMMING , stored in file volume-det1.h5 , containing following data (among others):

dataset1/data2/quality1/what:quantity="QIND"
dataset1/data2/quality2/what:quantity="CLASS"
dataset1/data2/quality3/what:quantity="EMITTER.LINE"
dataset1/data2/what:quantity="DBZH"
dataset1/data3/what:quantity="DBZH_norm"
dataset1/data4/what:quantity="DBZH_norm"
dataset1/quality1/what:quantity="QIND"
dataset1/quality2/what:quantity="CLASS"
dataset1/quality3/what:quantity="JAMMING"

Assume the other process detecting SHIP and SPECKLE stored in volume-det2.h5 , respectively:

dataset1/data1/what:quantity="TH"
dataset1/data2/quality1/what:quantity="QIND"
dataset1/data2/quality2/what:quantity="CLASS"
dataset1/data2/quality3/what:quantity="NONMET.CLUTTER.SHIP"
dataset1/data2/what:quantity="DBZH"
dataset1/data4/what:quantity="WRAD"
dataset1/quality1/what:quantity="QIND"
dataset1/quality2/what:quantity="CLASS"
dataset1/quality3/what:quantity="NOISE.SPECKLE"

These files can be combined simply with

rack volume-det1.h5 volume-det2.h5 -o volume-det-combined.h5

The resulting file contains structure as follows:

dataset1/data2/quality1/what:quantity="QIND"
dataset1/data2/quality2/what:quantity="CLASS"
dataset1/data2/quality3/what:quantity="EMITTER.LINE"
dataset1/data2/quality4/what:quantity="NONMET.CLUTTER.SHIP"
dataset1/data2/what:quantity="DBZH"
dataset1/data3/what:quantity="TH"
dataset1/data4/what:quantity="WRAD"
dataset1/quality1/what:quantity="QIND"
dataset1/quality2/what:quantity="CLASS"
dataset1/quality3/what:quantity="JAMMING"
dataset1/quality4/what:quantity="NOISE.SPECKLE"

Just like after running several detection processes, after reading files containing detection fields, global ie. elevation-specific quality data (QIND and CLASS ) are not implictly combined to local ie. quantity-specific quality data. As explained in detection , this combination takes place automatically if any removal command or –c –aQualityCombiner command is issued.