Introduction
This section explains general commands and useful hints in using Rack.
Does a radar overlap with a given geographical scope?
Consider generating a composite on a geographical scope defined by a projection and a bounding box. If the area is small with respect to the surrounding radar network, one should not read all the possible radar files at hand, even though Rack will automatically reject volume data which is out of scope. This is especially critical if radar data are archived, needing time-consuming retrieval, uncompressing and format conversion. Hence, one needs a means of advance checking if a radar should be included or not in the composite.
In Rack, commands of type --/xxx/xxx:yyy=zzz are interpreted as ODIM metadata to be set in the current HDF5 object. Rack always contains one object, initially empty, for which the metadata can be set as well. As for with a true input volume, one can check the geographical scope of this "volume" using --cBBoxTest command as follows, for example:
rack --verbose 0 \
--cProj '+proj=stere +lon_0=25.0 +lat_0=60.000' \
--cBBox '20,58,30,63' \
--/where:lon=26.32 \
--/where:lat=64.77 \
--/where:nbins=500 \
--/where:rscale=500 \
--cBBoxTest 1
The result can be checked from the return code, which is zero if the radar range overlaps with the composite domain, and non-zero otherwise.
Another way is to call --formatOut for each input volume, using --format that contains ${BBOX} and other desired status variables. For example:
rack --cProj
'+proj=longlat +ellps=WGS84 +datum=WGS84 +no_defs' --cBBox 20,60,30,70 \
--format '${BBOX} ${CMT} ${what:source} ${inputFile} \n' \
--verbose 0 --script '--cBBoxTest 1 --formatOut -' \
data/pvol_*
Definition DataSelector.cpp:44
Instead of giving nbins and rscale , the range can be given using the non-standard --where:range directly (in metres, for example 250000).
This command could be called by a script which iterates through sample files, and the results are catenated in a file like
# FMI radars
fianj=27.1111,60.9036
fiika=23.08,61.767
fikor=21.6465,60.1284
...
A further application could be in an operational compositing process, where another script iterates through these entries, testing locations with --cBBoxTest as shown above and including successful sites in the actual compositing script. A variable names, instead of output of ${what:source} above, it is practical to use radar site codes in the form they appear in filenames.
Validating data structure
Rack supports validating both input data and products it generates. The process uses comma-separated definition files by OPERA, originally designed by Ladislav Meri (SMU). Input data is validated by issuing --validate command after reading the data:
rack volume.h5 --validate ODIM_H5_V2_2_PVOL.csv
Output data – polar or Cartesian products – can be validated similarly, after generating the products:
rack volume.h5 --pCappi 500 --validate ODIM_H5_V2_3_PPROD.csv
rack volume.h5 -Q DBZH --cCreate --validate ODIM_H5_V2_3_CART.csv
Normal warnings and notifications are displayed upon exceptions. More verbose output obtained with --verbose 7 , for example. In future versions, automatic validator filename selection may be supported (based on attribute what:version ). Note: only some basic defition files have been designed by OPERA this far. Note2: Rack is mostly, but not fully, compliant to ODIM 2.2 and 2.3 .
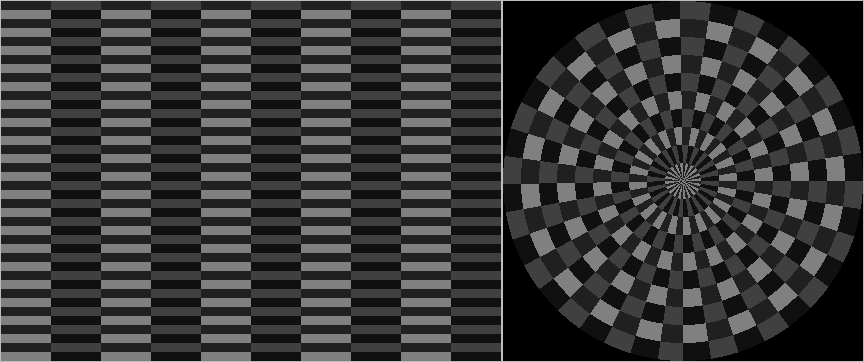
Creating test volumes
The following script can be applied to create test volumes.
#!/bin/bash
#
# Generates an artificial radar volume (chessboard data).
#
# Part of Rack distribution
#
# Markus.Peura@fmi.fi
PATH=${PATH}':/fmi/dev/bin'
QUANTITY=${QUANTITY:-'DBZH'}
OUTDIR=${OUTDIR:-"."}
OUTFILE=${OUTFILE:-"testdata-$QUANTITY.h5"}
NBINS=${NBINS:-'500'}
NRAYS=${NRAYS:-'360'}
RSCALE=${RSCALE:-'500'}
LON=${LON:-'25.0'}
LAT=${LAT:-'60.0'}
GAIN=${GAIN:-'0.5'}
OFFSET=${OFFSET:-'-32'}
UNDETECT=${UNDETECT:-'0'}
NODATA=${NODATA:-'255'}
# Base "data": a 2x2 grid replicated over the image
VALUES=${VALUES:-$(( RANDOM & 127 )),$(( RANDOM & 127 + 128 ))}
VALUES=${VALUES/:/,}
#VALUES=${VALUES:-"64:192"}
VALUES=( ${VALUES/,/ } )
DARK=${VALUES[0]}
LIGHT=${VALUES[1]}
#DARK=$(( RANDOM & 127 ))
#LIGHT=$(( RANDOM & 127 + 128 ))
DATA=${DATA:-"$DARK,$LIGHT,$LIGHT,$DARK"}
BASENAME=${OUTFILE%.*}
IMGFILE=${BASENAME}-raw.png
TILEFILE=${BASENAME}-tile.png
CMDFILE=${BASENAME}.sh
#
if [ "$COORD" == 'c' ]; then
cart='-c'
else
cart=''
fi
# PALETTE=default
if [ "$PALETTE" == 'default' ]; then
PALETTE=$QUANTITY
fi
palette=${PALETTE:+"--palette palette/palette-$PALETTE.txt"}
# Step 1: create png image file
echo $(( NBINS / 20 ))x$(( NRAYS / 20 ))
echo "P2 2 2 255 ${DATA//,/ }" | convert pgm:- -filter Point -resize $(( NBINS / 5 ))x$(( NRAYS / 20 ))\! ${OUTDIR}/${TILEFILE}
if [ ! -s "${OUTDIR}/${TILEFILE}" ]; then
echo "502 Could not generate tile file: ${OUTDIR}/${TILEFILE}"
exit 1
fi
if [ "$FORMAT" == 'sh' ]; then
OUTFILE=${BASENAME}.h5
fi
cat > $OUTDIR/$CMDFILE <<EOF
# Step 2: expand to a gridded png image
convert -size ${NBINS}x${NRAYS} tile:$OUTDIR/${TILEFILE} -type GrayScale -depth 8 ${OUTDIR}/${IMGFILE}
# Step 3: add ODIM variables, convert to HDF5
rack ${OUTDIR}/${IMGFILE} \
--/what:object=PVOL \
--/where:lon=$LON \
--/where:lat=$LAT \
--/how:simulated=True \
--/dataset1/where:nbins=$NBINS \
--/dataset1/where:nrays=$NRAYS \
--/dataset1/where:rscale=$RSCALE \
--/dataset1/data1/what:quantity=$QUANTITY \
--/dataset1/data1/what:gain=$GAIN \
--/dataset1/data1/what:offset=$OFFSET \
--completeODIM \
${cart} ${palette} \
-o ${OUTDIR}/${OUTFILE}
rm -v $OUTDIR/${IMGFILE}
rm -v $OUTDIR/${TILEFILE}
EOF
if [ "$FORMAT" != 'sh' ]; then
source $OUTDIR/$CMDFILE
fi
# That's it

Test data in its original polar coordinates and Cartesian projection.


 1.9.8
1.9.8